Object coordinates (fk5): Right Ascension = 278.3875, Declination = -10.58333333
Simbad query by right ascension and declination
|
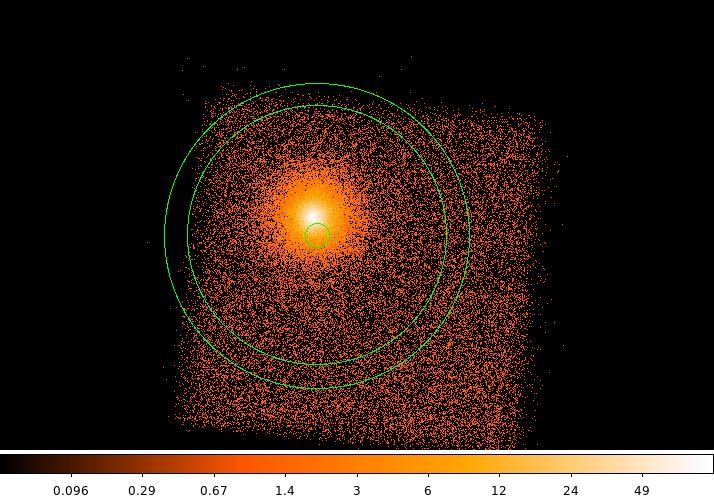
| DS9 image of the event files with source (circle) and background (annulus) regions used in data analysis overlaid. |
 |
 |
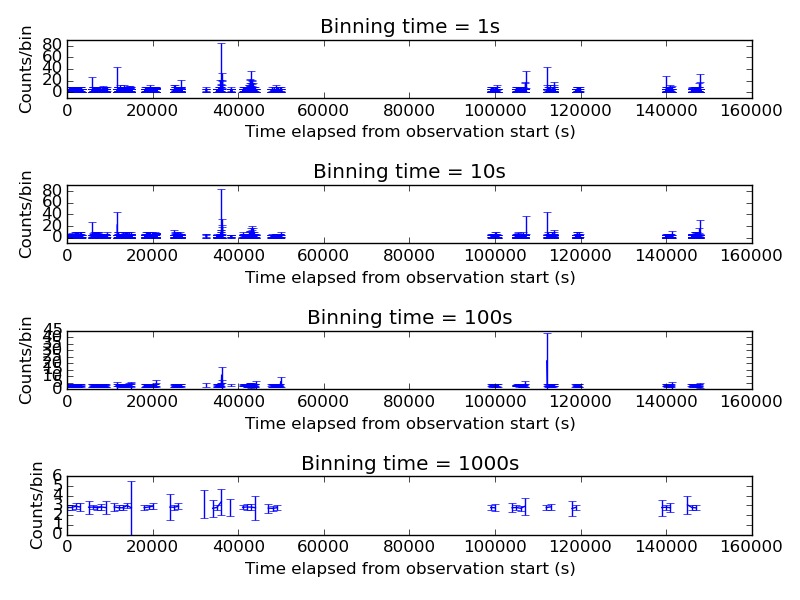
Light curve from Nuproducts light curve file rebinned in 1,10,100 and 1000s bins. |
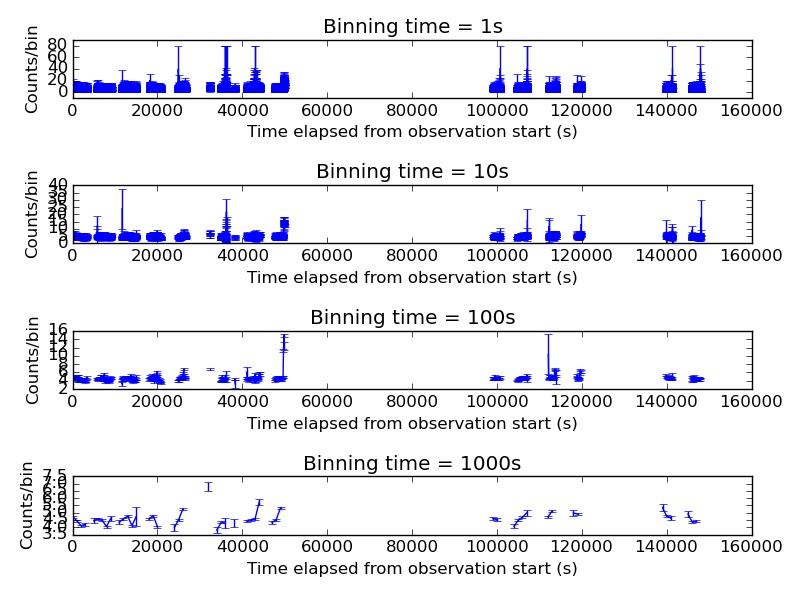
Light curve from Xselect using summed light curves from instruments A & B rebinned in 1,10,100 and 1000s bins. |
 |
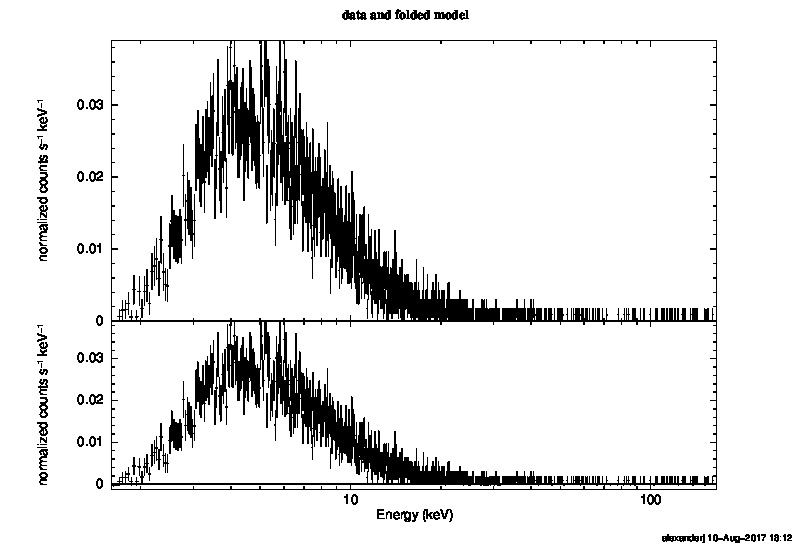 |
Energy spectrum plus residuals for a power law model with power law index fixed at 1. Reduced chi-squared=1.9974065934065934 for 4095 degrees of freedom. |
Energy spectrum plus residuals for a power law model with free power law index. Reduced chi-squared=1.9978944797264289 for 4094 degrees of freedom. |
 |
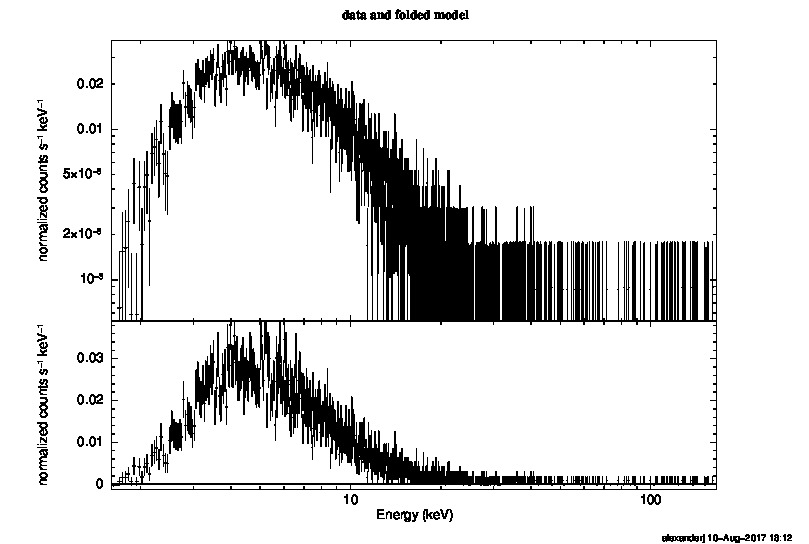 |
Energy spectrum plus residuals for a power law model with power law index fixed at 1. Data plotted on logarithmic axes. Reduced chi-squared=1.9974065934065934 for 4095 degrees of freedom. |
Energy spectrum plus residuals for a power law model with free power law index. Data plotted on logarithmic axes. Reduced chi-squared=1.9978944797264289 for 4094 degrees of freedom. |
 |
 |
Composite Lomb-Scargle power spectrum of all Nustar orbits using Nuproducts light curve. Plotted on linear axes. |
Composite Lomb-Scargle power spectrum of all Nustar orbits using Nuproducts light curve. Plotted with logarithmic x-axis. |
 |
 |
Composite Lomb-Scargle power spectrum of all Nustar orbits using Xselect light curve. Plotted on linear axes. |
Composite Lomb-Scargle power spectrum of all Nustar orbits using Xselect light curve. Plotted with logarithmic x-axis. |
 |
 |
Fast Fourier Transform cospectrum using both instrument (A & B) event files. Plotted on linear axes. |
Fast Fourier Transform cospectrum using both instrument (A & B) event files. Plotted with logarithmic x-axis. |
 |
 |
 |
Fast Fourier Transform cospectrum using both instrument (A & B) event files geometrically rebinned to 1.01. |
Fast Fourier Transform cospectrum using both instrument (A & B) event files geometrically rebinned to 1.03. |
Fast Fourier Transform cospectrum using both instrument (A & B) event files geometrically rebinned to 1.05. |
 |
 |
Fast Fourier Transform cospectrum using both instrument (A & B) event files linearly rebinned in 10s bins. |
Fast Fourier Transform cospectrum using both instrument (A & B) event files linearly rebinned in 100s bins. |